1. Time estimator2. Supplemental material
This website contains supplemental material for the article:
Morgane Koval, Yvonne Jansen. Do You See What You Mean? Using Predictive Visualizations to Reduce Optimism in Duration Estimates. CHI 2022 - Conference on Human Factors in Computing Systems, Apr 2022, New Orleans, United States. DOI 10.1145/3491102.3502010.
This work builds on previous research targeting the planning fallacy, a phenomenon in which underestimation of future tasks' duration is almost systematic and not lessened by the knowledge of how long past tasks have taken to be completed. We conducted a crowdsourced study (see scenario) based on the hypothesis that compound probabilities and mixture distributions, involved in the estimation of a task duration, are difficult to mentally process. 145 participants provided different estimates of overall and sub-task durations and we used these to generate predictive visualizations of the resulting mixture distributions (see resulting dot plots). We also introduced a linechart tool to half of the participants, aimed at supporting time-related decision making. The way they interacted with the visualization is presented with animated gif (see linecharts). The four conditions included in the experiment are accessible here to try out (for illustration only, no data is being logged). For more information on the procedure, analysis and results, you can refer to the paper, explore our OSF project, our pre-registration, or access the final data analysis output directly.
Static experiment pages 
Below are static screenshots from all experiment pages. Those which are specific to a certain condition are marked accordinaly in the top right corner. You can also try out the experiment yourself.
Interactive experiment pages
Each of the thumbnails below starts the interactive version of the experiment with the indicated factor values. These are for demonstration purposes only. No data is being logged.
Resulting dot plots
These are all dotplots that were generated for participants during the study. Each dotplot shows the 95% prediction interval calculated for a participant from the data they entered. To learn more about what kind of data they entered, see the static experiment pages and to try this out for yourself, see the interactive experiment pages.
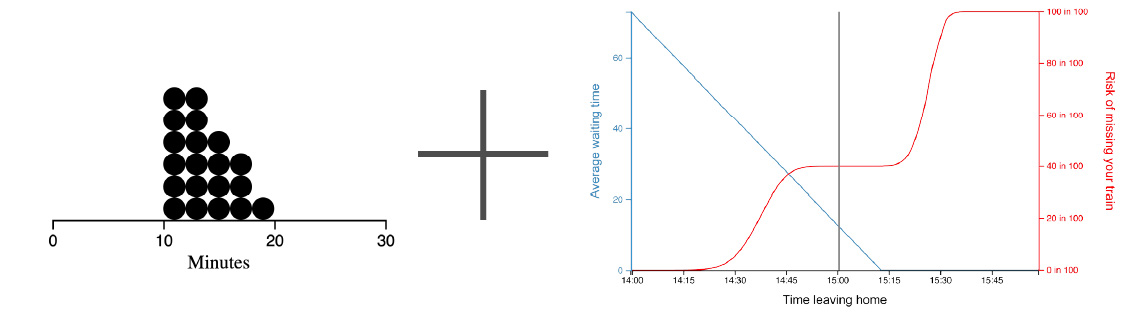
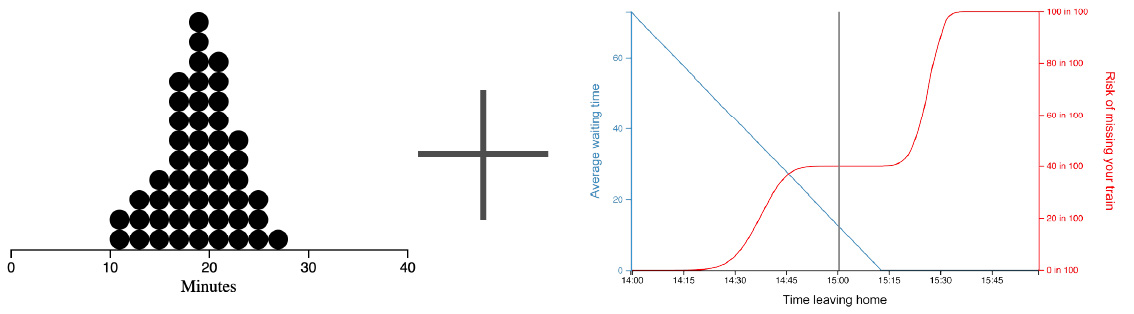
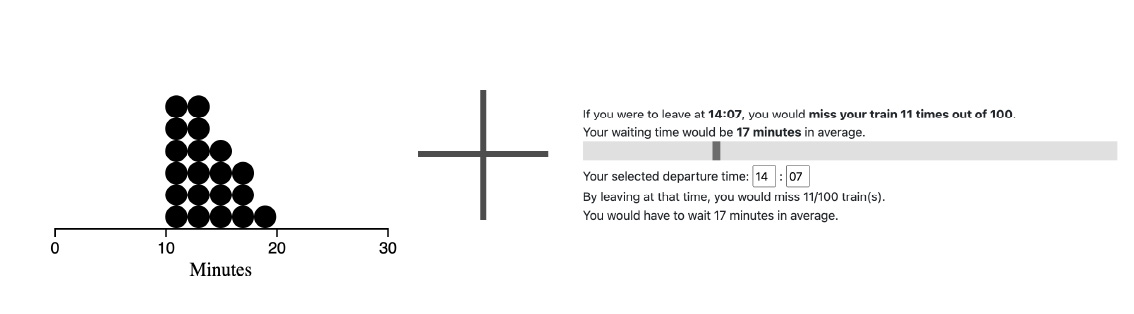
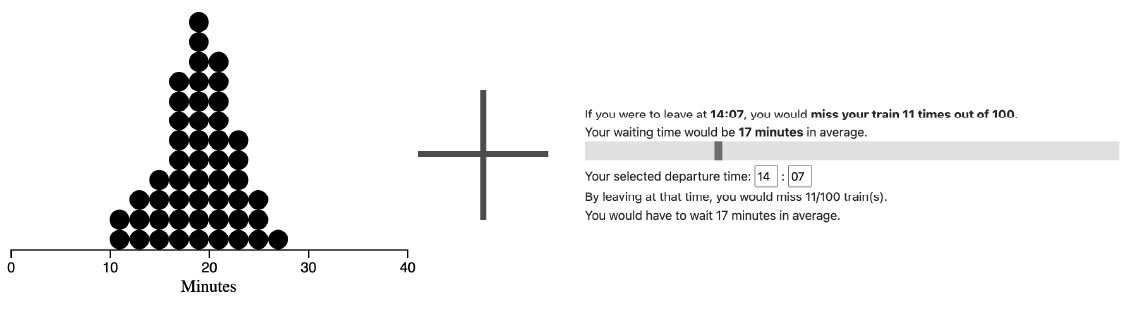
Animated linecharts
These are all the graphs generated for participants in the visualization condition of the decision making task. Based on the data participants had entered before, we computed the average waiting time and the likelihood to miss one's train when leaving at a specified time. A vertical line moved along the x-axis attached to the mouse cursor. Whenever a participant clicked, we consider this a "candidate" and logged a snapshot of the visualization. The animated graphs here show for each participant the different candidates they considered.
You can try this out with your own estimates through the interactive experiment pages.